Vector-Borne Disease Dashboard
Project overview
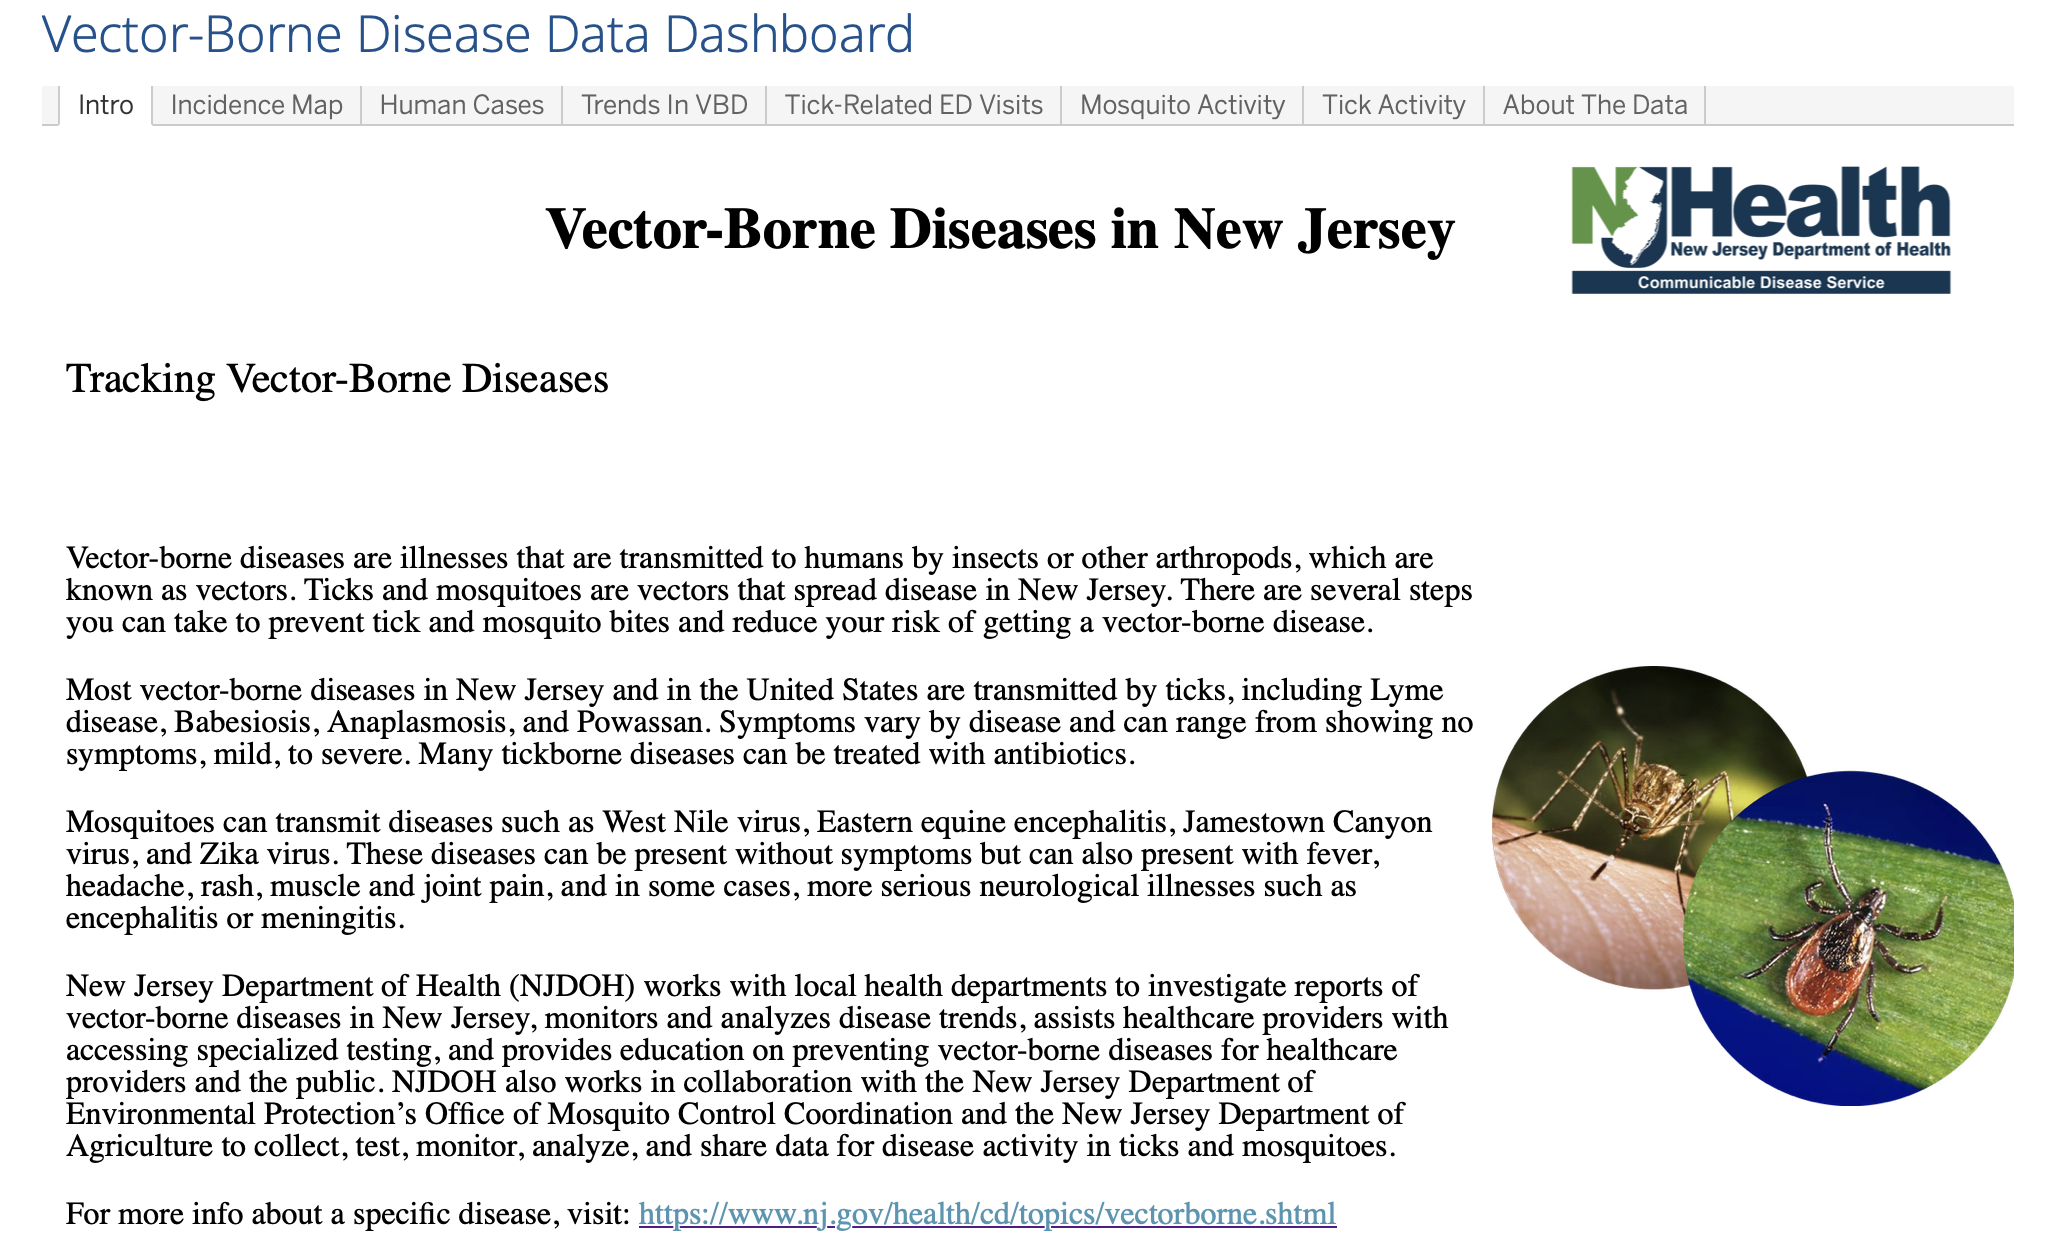
I led the development of a comprehensive dashboard to monitor and analyze trends in vector-borne diseases, specifically focusing on mosquito and tick activity in New Jersey. The dashboard integrates data from various sources, including public health records, syndromic surveillance data, and vector surveillance systems. It features interactive visualizations that allow users to explore disease incidence rates, seasonal patterns, and geographic distribution of vector populations. Key functionalities include:- Real-time data updates to reflect the latest surveillance information.
- Heatmaps to visualize areas with high vector activity and disease incidence.
- Trend analysis tools to identify emerging patterns and potential outbreaks.
- User-friendly interface for public health officials and researchers to access and interpret data easily.
The project involved collaboration with epidemiologists, vector control staff, and data analysts to ensure the dashboard met the needs of its users. The end result is a powerful tool that aids in the early detection and response to vector-borne disease threats, ultimately contributing to improved public health outcomes in New Jersey. The dashboard can be accessed here or by clicking the image above.Technologies Used:
- Programming Languages: R
- Data Visualization: Tableau (Server)
- Data Cleaning: Tableau Prep